This tutorial demonstrates how resources allocation chart (histogram/S curve) is produced in Primavera P6. Assume that you have done “Assigned activities and Sequenced activities to see resource loading histogram/S curve bar chart in Primavera P6. After assigning and sequencing of activities, (1) allocate overall resource and their rated cost and (2) assign resources in activity detail section (3) view resource loading histogram/S curve.
1) To allocate overall resources and cost,
a) Go to Enterprise
Note: When you are at Resource, you will see the filter name “Current Project Resources” If you have already opened a resource loaded project. See figure below

b) Add New Resource (If the existing resources are not applicable for a specific project or there is no resource to be assigned).You can skip this step if the required resources have been in.
When you try to add resource, you will get the message like “In order to add resource, the filter will be changed to display all resources” and you will see all resources for all the projects. New Resource Wizard will be prompted, and follow the wizard. You will be asked to enter the following,
Ø Resource ID,
Ø Resource Name,
Ø Allocate Resource Type (Labor, Non labor and material),
Ø Rate (Price/Unit), Default Units/Time and Max Units/Time,
Ø Contact address if applicable
Ø Resource roles which describes their skills
Ø Resource Calendar
Ø Select “Auto- compute if you want actual units are updated by primavera or select “Do not auto-compute actual” if you can update manually for actual man hours spent.
Ø Timesheets set up and log in
After entering of all data, you will notice that the newly added resources are not in the desired location. Therefore, allocate those resources according to their resource level. For example, Pipe fitter, Rigger/Signaler, General worker, Fire watches man, Workshop labor, Painter, etc are allocated under construction department of Petrochemical Projects. See figure below.

2) To assign resources in activity detail section, Go to Activities page > Select the activity > Go to Resource tab which is next to Relationships tab > Add Resource which is located near the bottom of activity detail box > Select required resource and assign it
3) To view manpower histogram and S curve,
(a) Go to Activities page > Select Resource usage profile, and then you will see “Current Project’s Resources” Column on the left and histogram and bar chart on the right side of the layout. The individual loading chart, for instance, welder’s resource profile is shown in the following figure.

b) You can customize the appearance of bar chart by the Resource Usage Profile Options. Right Click on the bar chart area to find Resource Usage Profile Options. You can select “By date” to see interval data (Histogram Chart) and select “Cumulative (S Curve) to see total manpower unit in the following check box below.

c) The following check box is used when you want to show manpower resource profile instead of man hour unit. P6 will calculate total men per period (interval) based on working hrs per period (interval) and total man hours per period. For example, total men per week would be 10 when total man hours for a week are 400 and 40 working hrs per week.

d) And then, select all resources in resource column to view overall man power allocation. To print the bar chart, Go to print preview > page set up > Options > Select “Profile” and unselect Activity Table, All columns, Grid lines and Gantt chart. Set the time scale start from “PS-Earliest Project Start” to “PF-Latest Project Finish”. Finally you will see the bar chart as below.

e) According to above bar chart, the weekly interval manpower is shown on the left side and total manpower allocation is on the right side.
f) You can also see “Stacked Histogram” for this manpower allocation. Right Click on the bar chart area to find “Stacked Histogram”. Firstly, click on "Stacked Histogram" tag, and then you can go to "Resource Usage Profile Options" to get screen shot in step-g. See figure below.

g) Go to Resource Profile options > Assign Resource Filter/Group Name > Select Total cumulative curve as shown in Figure below.

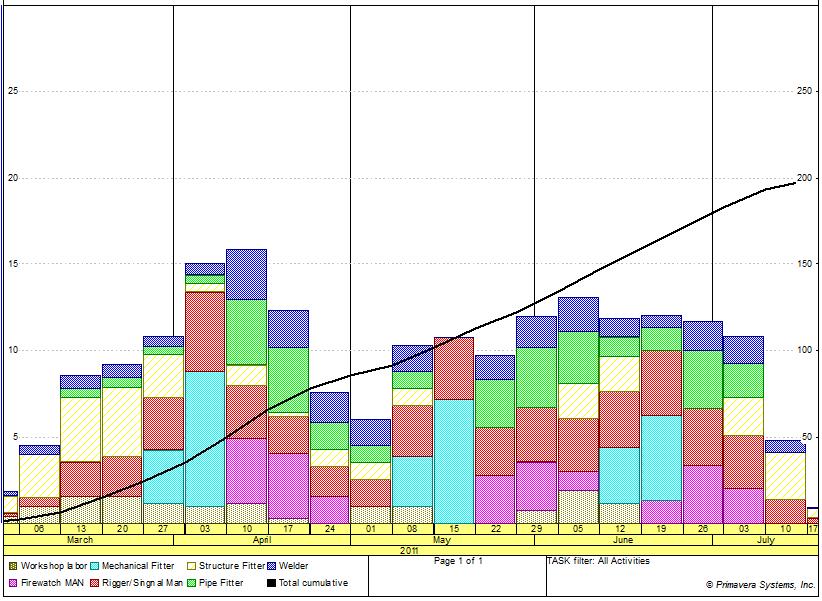
Finally, you will get Stacked Histogram as shown in below. The stacked histogram represents the manpower allocation by individual trade/discipline as well as total manpower allocation (total manpower = 200 men, see the following figure) . It can be printed the same way done on item 3, d.
There are the related posts (1) Tutorial-How to generate S curve/histogram from Primavera, P6 which describes how the progress (histogram curve/S curve) are produced using P6 export excel data.
Wow that was unusual. I just wrote an very long comment but after I clicked submit
ReplyDeletemy comment didn't show up. Grrrr... well I'm not writing all that over again.
Regardless, just wanted to say superb blog!
Hi there everybody, here every person is sharing these kinds of knowledge, so it's
ReplyDeletenice to read this blog, and I used to pay a visit this weblog daily.
Write more, thats all I have to say. Literally,
ReplyDeleteit sedems as thhough you relied on the video to make your point.
You clearly know what youre tlking about, why throw awaay your intelligence on just posting videos to your site when you could be giving us something
enlightening to read?
I want to to thank you for this very good read!! I definitely enjoyed every little bit of it.
ReplyDeleteI have you saved as a favorite to cheeck out new things you post…
Hi, Neat post. There's an issue along with your website in internet explorer, may check this?
ReplyDeleteIE still is thee marketplace chief and a huge cokponent of other folks will leave out your magnificent
writing due to this problem.
Does your site have a contact page? I'm having a tough time locating it but, I'd like to shoot you an e-mail.
ReplyDeleteI've got some recommendations for your blog you might be interested in hearing.
Either way, great site and I look forward too seeing it expand over time.
I have read so many articles regarding the blogger
ReplyDeletelovers except this piece of writing is genuinely a pleasant paragraph, keep it up.
We're a group of volunteers and starting a new scheme in our
ReplyDeletecommunity. Your website provided us with valuable info to work on. You've done
a formidable job and our entire community will be thankful to you.
Thank you for the good writeup. It in fact was a amusement account it.
ReplyDeleteLook advanced to more added agreeable from you!
By the way, how can we communicate?
Excellent post. Keep posting such kind of information on your site.
ReplyDeleteIm really impressed by it.
Hey there, You've done an incredible job. I will
certainly digg it and in my view recommend to my friends.
I'm sure they will be benefited from this website.
It is not my first time to visit this site, i am visiting this web site dailly and get fastidious data from here everyday.
ReplyDeleteI read this post fully on the topic of the resemblance of most up-to-date and
ReplyDeletepreceding technologies, it's awesome article.
I’m not that much of a internet reader to be honest but your sites really nice,
ReplyDeletekeep it up! I'll go ahead and bookmark your site to
come back later. All the best
It's going to be finish of mine day, but before end I am reading this wonderful article to improve my experience.
ReplyDeleteThis post ofters clear idea for the new people of
ReplyDeleteblogging, that genuinely how to do blogging.
Hi i am kavin, its my first occasion to commenting anywhere, when i read this article i thought i could also make comment duee to
ReplyDeletethis sensible paragraph.
Primavera course in Gurgaon
ReplyDeletehttps://www.wikiful.com/@trainingingurgaon/easy-ways-you-can-turn-python-training-into-success/best-primavera-training-institute-in-gurgaon
APTRON offers the best Primavera course in Gurgaon to update your abilities in different areas too. APTRON's Primavera training is further developed with the most recent refreshed points. Notwithstanding the upgraded Primavera arranging information, they increment its ease of use in different conditions also.