The following steps you should have done before S curve is generated.
- Establish WBS
- Adding activities, Activity codes, Activity sequencing
- Define resource dictionary
- Assign activity resource and budgeted man hour
- Save as a baseline schedule
- Record the actual status when the actual works are done and schedule it based on report date
Plan data can be produced if the steps 1 to 5 are done. The actual data also can be exported if all the steps are done. Suppose you have already done all these steps as we are learning about how to generate S-curve/ Histogram chart from P6 in this post.
There is more than one method to generate the time-based S curve and histogram chart from P6. The related posts you might be interested are How to Get Resource Loading Histogram/S Curve in Primavera P6 and Creating discipline wise manpower histogram using Primavera P6 export data. This post demonstrates how these curves are produced by using Excel export data from Primavera, P6. Use the following procedures;
- Open the selected project
- On the menu bar, go to View >> Toolbars >> Directory to see “Assignments” tag

3. Click on Assignments tap, then you will see “Resource Assignments” window

4. Go to View on the menu bar >> Columns >> Customize.
5. And then you will see the Columns window. In the selected options box, Activity ID, Activity Name, Resource ID Name, Start and Finish columns are shown by default.

6. Select Actual units and Budgeted units from units group in the available options box, then click the forward arrow diagram to show actual units and budgeted units as shown in figure below.

7. After Actual and Budgeted Units are selected, hide Start and Finish by clicking backward arrow if you don't want to see it. And Click Ok. Then resource assignments window can be viewed as shown in figure below.


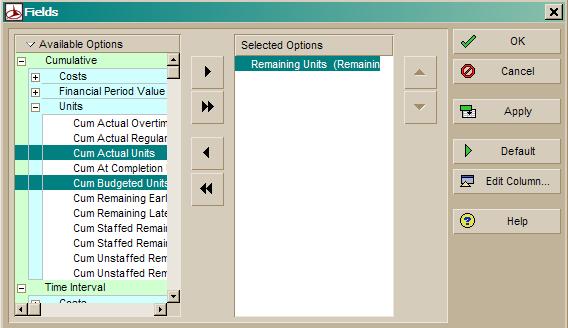
10. Point the mouse to anywhere on the resource usage spreadsheet field area and click on Display button. Go to spreadsheet fields >> customize as shown in figure below.

11. Then you will see the spreadsheet field window showing available options and selected options. Remaining Units (Remaining) is shown in selected options field by default. It is used when the remaining percent complete or remaining man hour data are analyzed. For now, select Remaining Units and hide it by clicking backward field.
Click the forward arrow button to select Cum Actual Units and Cum Budgeted Units as shown in figure below.
12. Finally, you will see the resource usage spreadsheet field showing “budgeted units and actual units” fields and data that can be exported to excel by copy and paste.

13. Things that we should have done before export P6 data to excel are resource grouping and time scale format. Resource grouping represents what you want to report or analyze. Group the resource as total when you want to see overall summary data only. To view Group and Sort window, go to view >> Group and Sort by >> Customize. In Group and Sort window, mark on Show Grand Totals and Show Summaries Only to see overall summary data. See figure below.

14. You may change the time scale format. The exported P6 data would be displayed as weekly if the date interval is set to month/week. To see this changes, click the display button on the spreadsheet field area. Go to Timescale and you will see Timescale window >> set to calendar in the date format type box and month/week in the date interval box.


15. Then click on the shading area and select all. And then copy and paste the data to excel. See figure below.

16. Suppose the exported data is as shown in figure below. As we set Cum Budgeted Units and Actual Units in the spreadsheet option field, you will see Cum Budgeted Units and Actual Units data through the project start to the end date.

17. To analyze overall progress quickly, you can find Plan Value Qty (Budgeted Units) is 3047 and Earn Value Qty (Actual Units) as of 28 Nov 09 is 490. Therefore overall progress as of that data date is (490/3047) 16%.
18. To create progress S Curve and weekly progress histogram chart, populate the progress data . Then finally you will get the S curve and histogram curve showing progress data and bar chart.

No comments:
Post a Comment