- Open the selected project that you need to export data
- Select the Assignments tag on the Directory or go to Project on the menu bar and go to Resource assignments. You will see then Activity resource columns such as Activity ID, Activity Name, Resource ID Name, Start and Finish by default. There is Remaining Units column in Resource Usage spreadsheet field column by default.

- As resource name (discipline wise) needs to be shown in Activity resource columns, you need to customise default view. To do so, go to View on the menu bar>>Columns>>Customize.
- Look for Resource Name in General tag in Available options box. Select Resource Name into Selected options box.

- Select Budgeted Units and Actual Units in the spreadsheet field columns if you want to see budget and actual data. You will get remaining early and late manpower data if select Remaining Earl Units and Late Unit. In this tutorial for instance, I just selected the budgeted units.
- To see budgeted units, go to Resource Usage Spreadsheet area and right click>>select Spreadsheet fields>> Select Budgeted Units.
- To set resource usage hour per period, go to Resource Usage Spreadsheet area and right click>>select Timescale>>select month/week (to show weekly data) from date interval drop down list.
- Go to View>> Group and sort by>> Customize and tick on Show Grand Totals, Show Summaries only to see summary data.
- Go to View>> filters and add the Resource ID names that you want to export data.

- Make sure the data is organized as you like to display in excel sheet in order to reduce rework after exporting to excel. To do that, stay at the Resource Assignment view, go to View on the menu bar > Group & Sort by > mark on Show Grand Totals and Show Summaries Only box just to display overall level and discipline level summary resource data overtime.
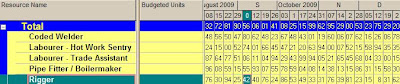
- Finally you will get resource loading data ready to export to excel as shown in figure below. Manpower field names such as Coded welder, Hot Work Sentry, Trade Assistant, Pipe fitter/Boilermaker and Rigger are displayed in the Resource Name column. Man hour distribution data is shown in the resource usage spreadsheet field.
- To export, go to activity resource assignment area >> select all>>copy and paste to excel. The man hour distribution will vary according to time scale. Suppose if the time scale is set up by (month/week), the data is weekly man hour data. If you want to convert the weekly manhour to weekly manpower , that feature is available in P6. The periodic average manpower can be calculated using the spreadsheet option box by selecting "Calculate Average" and entering working hours per week.
- Finally you can create Histogram Chart using that excel data.
Wednesday, December 28, 2011
Creating discipline wise manpower histogram using export data to excel


Subscribe to:
Post Comments (Atom)
No comments:
Post a Comment